Debugger is powerful tool for embedded programmer. Most of Atmel amateur users lives in Arduino (and programs their aplications thru bootloader) or outside arduino with USBASP (programs applications by ISP). With some exceptions most of them use programmer only and therefore must use hard invasive complicated debug mechanisms like printf, printf to display, led toggling etc. Almost due relative high prices of Atmel Debug tools. Last years Atmel comes with Xplained kits with embedde (mEDBG) debugger, unfortunately it is not full-feature debugger (in contrast with ST and their Nucleo and Discovery kits). I dont know if it is business politics or Atmel has some practical reasons but true is that Xplained kit hide its potential as low-cost debugger. I've done some succeful "hacks" to convert Xplained kits into limited debuggers. I believe there will be amateurs who will want to rebuild the debugger kit. That's why I place a pictorial commentary here.
First i'll show how to hack Xplained Mini (328 or 168) into DebugWIRE debugger, because it have the most potential for arduino users (i've tested debug at UNO and Nano modules). Of course it is not dedicated for Arduino only, most of Attiny's can be debugged that way. Primary limitation of that "home-made" debugger is clock configuration. mEDBG needs to clock target application with its own clock (later i'll discus details). mEDBG generates 16MHz respective 8MHz clock (selected with source voltage 5V respective 3.3V) and its easy connect that clock to target application even if its equipped by crystal oscillator. You simply connect clock to XTAL1 and it simply "beat" crystal. It is possible to clock application by lower frequency then 16 or 8MHz, but it looks there is no way how to clock it by crystal or internal RC oscillator. Not good but not bad situation. And now let's look to do it.
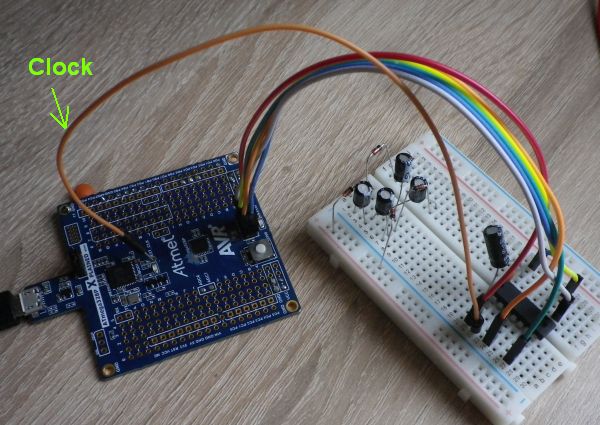
You probably want to power your application from "debugger" (lets call it by its name mEDBG). You have to populate Jumper J300 nad remove R300 (its bypassing voltage regulator). Next step you have to disconnect target chip at Xplained board. Best way is to remove mega328 by hotair gun, but if you havent any, there is another simple way - cut lines. You need cut SCK,MISO,MOSI and RESET. Good idea is cut them in such places to work 6pin ISP connector. Necessary cuts are show at images below. Note that you have to cut between vias and chip ! As next move you can remove R107 and R108 and disconnect Rx,Tx lines. After populating J104 you can use USB->UART bridge ability of mEDBG. Dont forgot connect cable to clock (EXT_CLK), you'll need it for debugging. Its good idea disconnect clock from rest of board by cut on its back.
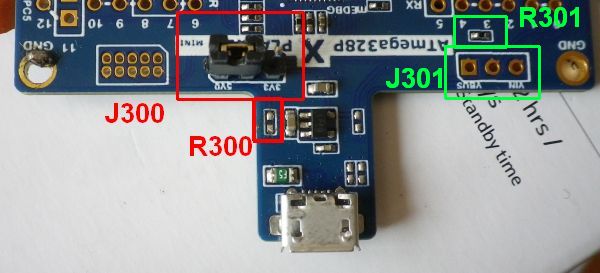
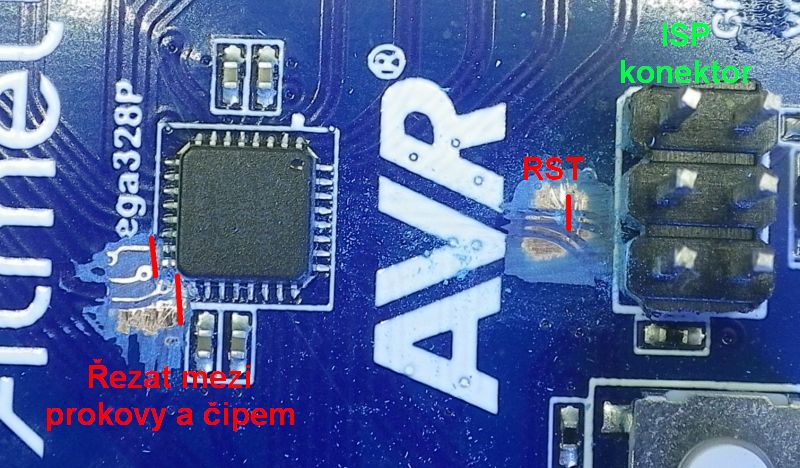
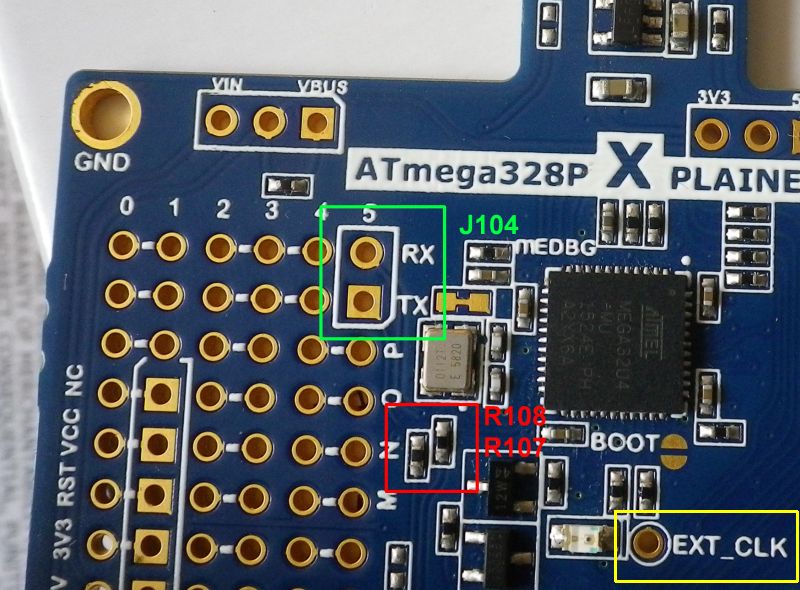
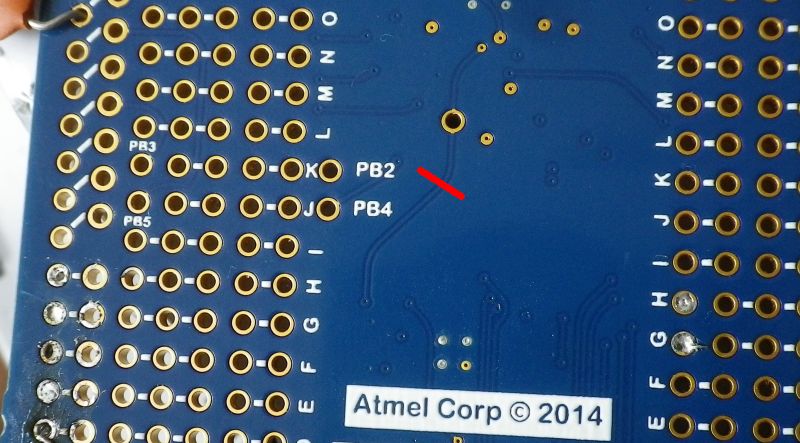
Now its time to connect debugger to some aplication and show how to start debugging. For example i've conect Attiny24, ISP like usualy at MISO, MOSI,SCK, RST and clock to XTAL1.
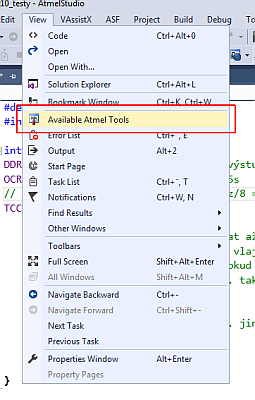
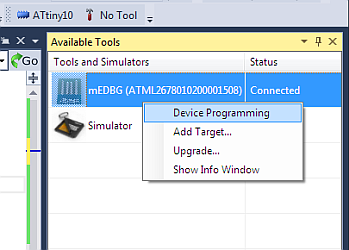
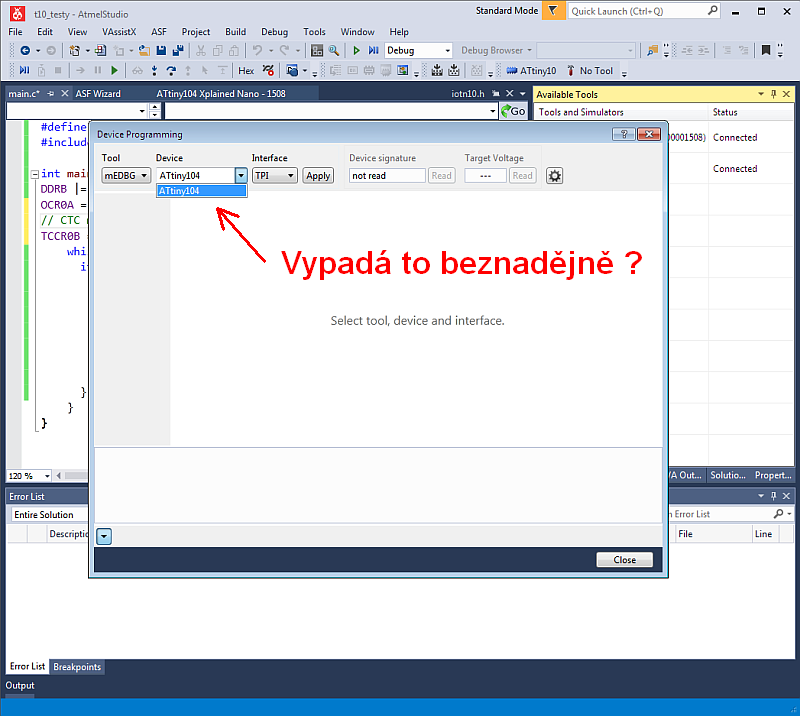
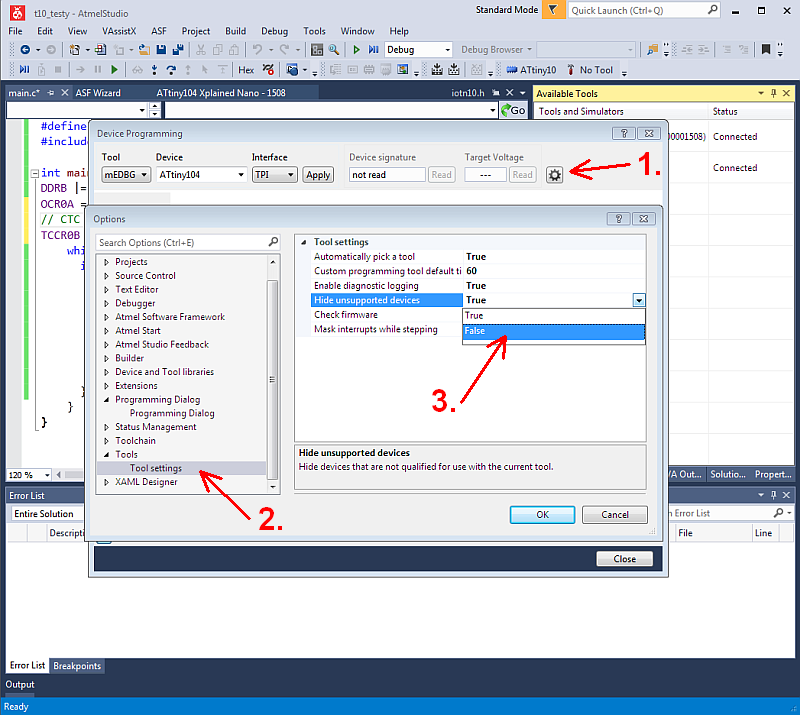
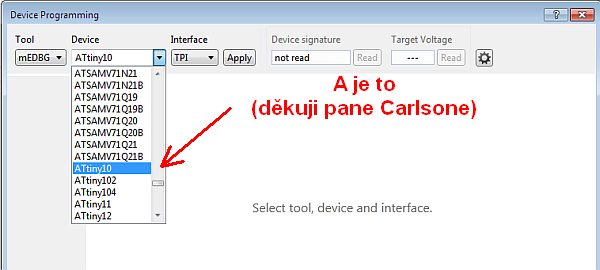
Start Atmel studio, connect Xplained board to USB and you should see it in View->Available Atmel Tools. Click it by right mouse button and select Device Programming (another way is Tools->Device programming). Picture tutorial have been created for "hack" Xnano module to TPI programmer (more about this later), but setup for Xplained is the same so do not stop over that "tiny104" and "TPI". Now you can select only one device - mega328/168 (depends which kit you have). At website of Jay Carlson i've read that limitation is only software block in Atmel studio. Lets remove it. Click at icon "gear" (options). Select Tools->Tool Setting and change Hide Unsupported devices to False. Close and open window again and now you have acces to all Atmels. (Follow screenshots)
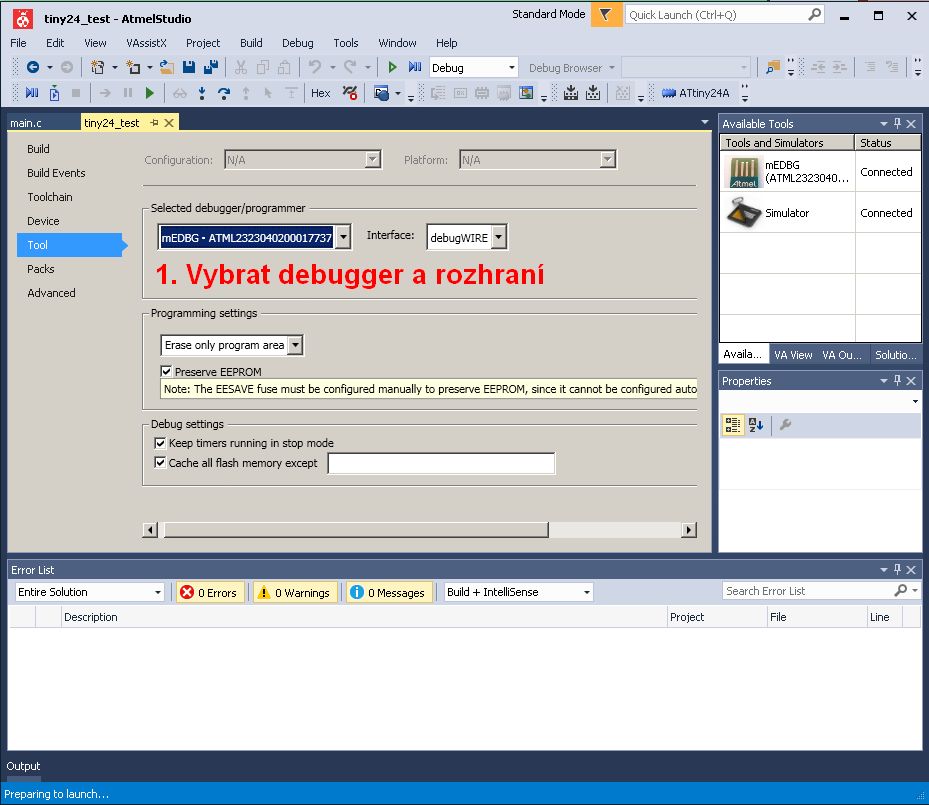
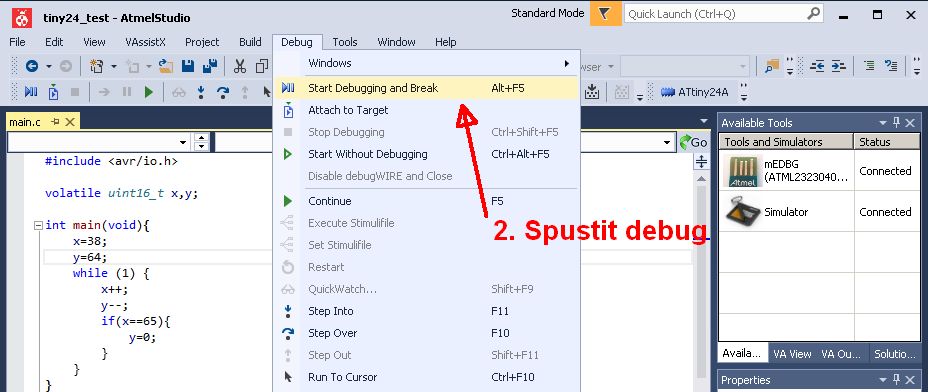
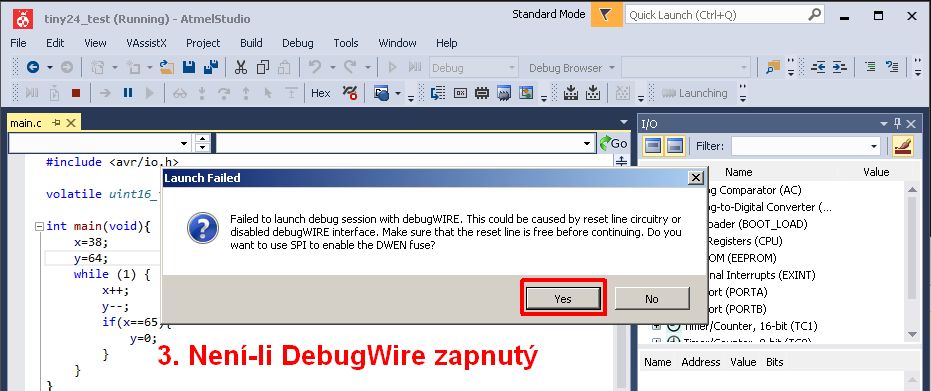
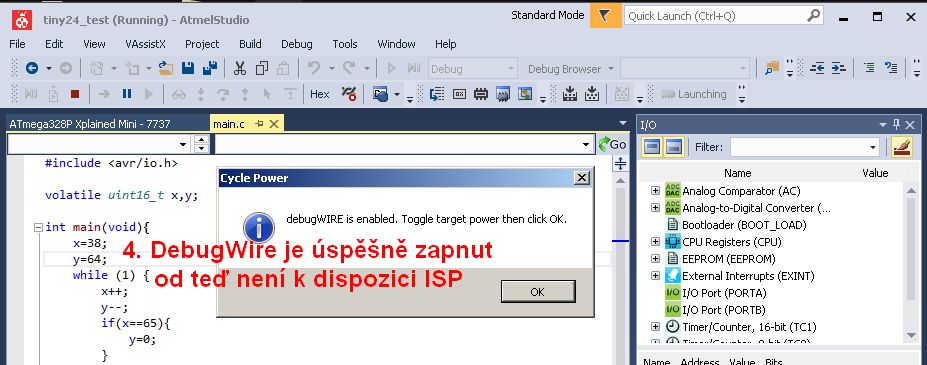
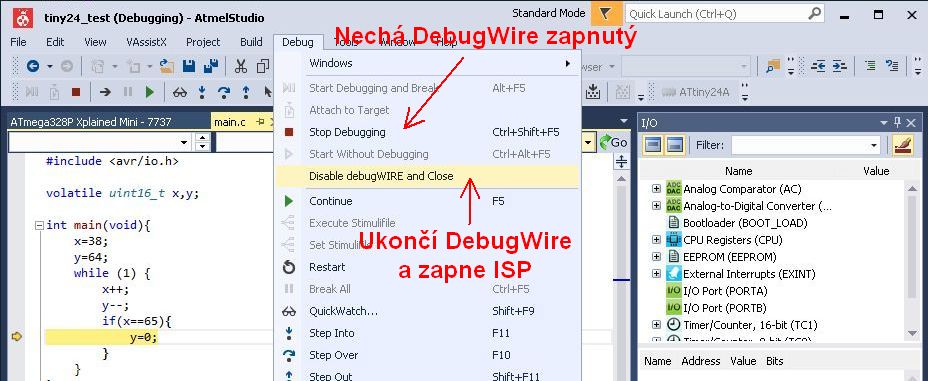
Now you are able to debug, but dont forgot. With start debugging session mEDBG switch fuses to external clock. Its possible by python script reconfigure mEDBG to dont do this, but i have not tried it. mEDBG hide many of fuses configuration (also can be repaired in python script). If you need (and you will) reconfigure fuses by mEDBG you have to input hexavalues manually (for example from engbedded AVR Fuse calc). Now let's take a look at debug starting. At Project->Properties->Tools select mEDBG and debugWIRE. When you start debugging, mEDBG ask you if you want to enable DWEN fuse (switch from ISP to DebugWIRE interface), select yes (and dont forgon that from this point you have not acces to ISP). If you connect everything correctly (dot forgot clock!) Atmel studio reporst succes and ask you to "cycle power" (its not necessary). If debug dont start immediately, slect "start debugging" one more time (and be patient - flashing chip by debugWIRE is slow). Program should start and break at first line of code - you are in debug mode ! If you want to stop debugging - click Stop debugging. But if you want to disable debugWIRE and get acces to ISP, you have to click Disable DebugWIRE and close.
Similar hack can be done with Xplained Nano kit and its TPI programmer. TPI interface can only program smalles Attiny's. If anyone is interested i can add tutorial how to modify that kit. Probably the most interesting and promising is modifiying ATtiny416 Xplained Nano, because it opens doors to new, peripheral rich, Atmel chips with debugging interface. If i succes with that, i'll publish instructions. I'am waiting kit in week or two.
Home
V0.5 21.7.2018
By Michal Dudka (m.dudka@seznam.cz)